DRRM communication control center through AI-powered chatbots
Why we built it
Project HERMES started from a simple observation: incident reports are usually messy. People send messages in chat apps the way they normally talk. That is good for humans, but not great for systems that need structure, speed, and clarity.
In DRRM operations, that gap becomes a real problem. A single report might mention location, severity, and description all in one message, or sometimes none of it clearly. Someone still has to read, interpret, and reformat everything manually.
We wanted to reduce that friction.
So we built HERMES as a bridge between informal human communication and structured incident data. It sits in the middle, listening to chat messages and turning them into something usable in real time.
How it turned out
HERMES ended up as a live incident intake and coordination system that runs entirely through chat interfaces and a responder control center.
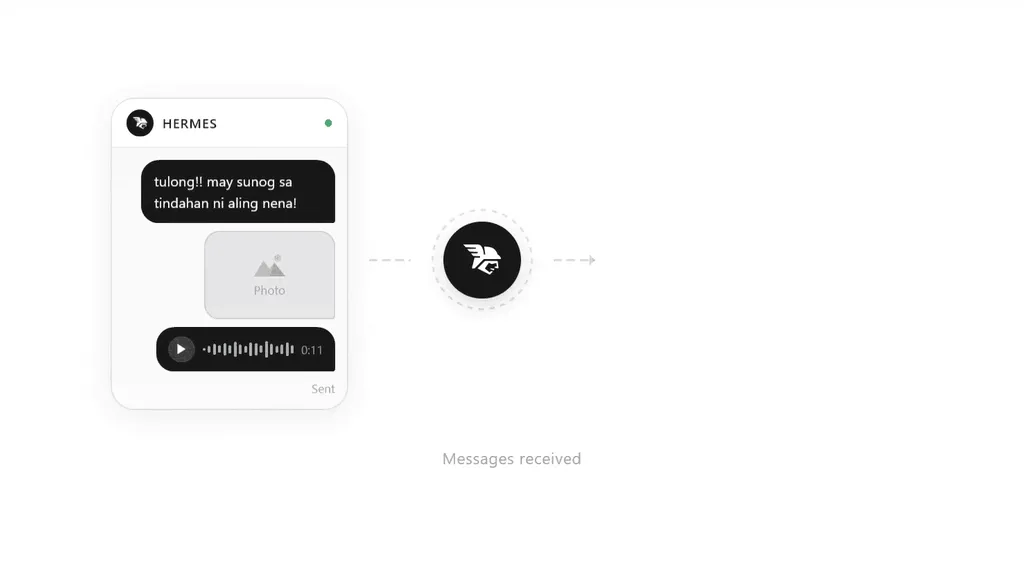
Messaging-based reporting
Residents report incidents through Telegram or Messenger. On first contact, they go through a simple onboarding flow where we collect basic profile details like language and location.
They can submit reports in two ways:
- Freeform messages that get parsed by the NLP pipeline
- Guided form-based reporting using structured prompts
Both routes end up in the same incident pipeline.
Incident feed
Responders monitor a real-time feed. Incoming incidents appear instantly in the dashboard.
We built multiple ways to view and manage incidents:
- List view for fast scanning
- Table view for detailed inspection
- Kanban view for workflow-style tracking
Incident view
Each incident has a dedicated panel where responders can:
- Read full chat history
- Review parsed structured fields
- Edit or validate extracted data
- Update incident status (new, ongoing, resolved, etc.)
This edit step is important because the system is not fully automated. Human validation is part of the workflow.
Map visualization
Responders can have a spatial live view of incidents on a map.
- Incidents are plotted as markers
- Severity is visualized using color coding
- Clusters or heatmap-style views help with dense areas
Advisory system
Responders can broadcast advisories back to residents through chat.
- Custom message composer
- Predefined templates for common alerts
- Target residents’ locations by drawing on the map
Data export
Incident and advisory data can be exported as PDF or CSV for reporting and offline analysis.
Admin and access control
We built a full admin layer with:
- Role-based access control for responders and admins
- User invitation system (via email)
- Ability to manage accounts
How we built it
Technologies we used
| Frontend | Next.js with PWA support + Tailwind CSS + shadcn/ui |
| Backend | Next.js API routes + Supabase (PostgreSQL + Auth + Realtime) |
| Chat Integration | Vercel Chat SDK (Telegram/Messenger adapters) |
| AI Integration | Vercel AI SDK |
| Maps Integration | MapLibre GL |
| Deployment | Vercel |
What I learned
This project taught me a lot about building systems where AI is not the product, but just one component in a larger pipeline. The hardest part was not making the model extract fields. The harder part was designing the whole system around it.
I also learned that integrating chat platforms made me appreciate how constrained those environments are. You do not control formatting, structure, or even consistency. You only get messages. Designing around that constraint was one of the more interesting parts of this project.